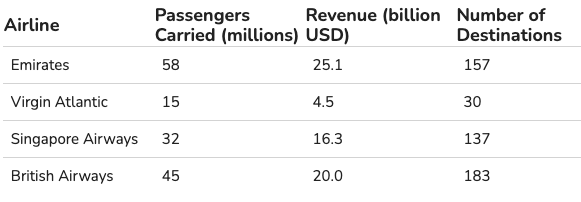
Explanation:
The task is to determine which airline showed a larger increase in passengers from the previous year based on the increased numbers provided:
British Airways: Increase in passengers from 2018 to 2019: 5,000,000
Virgin Atlantic: Increase in passengers from 2018 to 2019: 3,000,000
Since British Airways increased by 5,000,000 passengers, and Virgin Atlantic increased by 3,000,000 passengers, the airline with the larger increase is British Airways.

Explanation:
The airline that carries the most passengers among the options given is Emirates, with 58 million passengers carried.
Explanation:
We use the percentage change formula. (120-115)/115 = 0.0435 = 4.35%
Explanation:
First, we work out the average precipitation for each location:
Tirana (135+150+130+115+120)/5 = 130
Algiers (80+75+55+60+40)/5 = 62
Then we subtract the smallest from the largest to find the difference:
130 - 62 = 68
Explanation:
We need to calculate how much is 15% out of 25. (25x15)/100= 3.75 So the actual figure is 25 - 15% = 25 - 3.75 = 21.25 Hence using the percentage change (increase) formula, there is a (30-21.25)/21.25 = 0.41 = 41%
Explanation:
Step 1: Calculate the total snowfall in Val Thorens across the 4 months.
5cm + 20cm + 40cm + 35cm = 100cm
Step 2: Divide the January value by the total and multiply by 100 to calculate the amount as a percentage.
5cm / 100cm x 100 = 5%
Explanation:
Step 1: Identify how much snow fell in Whistler in November and December:
Nov = 20cm
Dec = 30cm
Step 2: Calculate the difference between the two amounts:
30cm -20cm = 10cm
Step 3: Divide the difference by the November figure 'the old figure' and multiply by 100.
10cm / 20cm x 100 = 50%
Tip: To calculate the percentage increase quickly: Subtract the newest figure from the oldest figure and divide by the oldest.
Advertisement
Explanation:
Step 1: Calculate a 20% increase in the December snowfall in Val Thorens and Whistler:
(30cm + 35cm) × 1.2 = 78cm
Step 2: Calculate a 15% decrease in the December snowfall in Tignes and Les Arc:
(20cm + 30cm) × 0.85 = 42.5cm
Step 3: Add the two values together:
Total = 120.5cm
Explanation:
Step 1: Calcuate how much snow fell in January in Whistler and Les Arc:
Jan = 10cm + 10cm = 20cm
Step 2: Calcuate how much snow fell in February in Whistler and Les Arc:
Feb = 20cm + 20cm = 40cm
Step 3: Add the two figures together:
Total = 60cm
Explanation:
The title of the table shows that the number of readers for each newspaper is in the millions. Then, looking at the figures for year X+1, we can see that 7.5 million readers read the Sun. We can also see that 10.2 million readers read the Times. By making a simple addition calculation (remember that calculators are allowed!), we arrive at a total of 17.7 million readers.
Explanation:
By adding the number of readers for each newspaper in years X and X+1, we find the following:
- - The Times: 23.6 million readers
- - The Daily Telegraph: 42 million readers
- - Metro: 49.1 million readers
- - The Sun: 22.8 million readers
- - Guardian: 40.2 million readers
Therefore, the Metro is the newspaper with the most readers during these two years.